Time:2024-02-10 Click:162
The technical indicators we are going to introduce in this article are deviation rate and Bollinger Bands. The concept of Bollinger Bands is a little more complicated, but it is not difficult to understand. This article is also the last one on technical analysis indicators. Starting from the next article, we will introduce several common technical analysis types. Friends, please study carefully with patience!
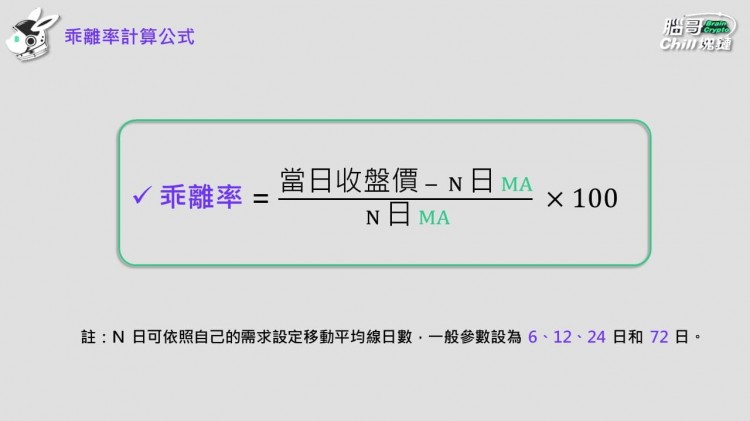
The divergence rate (BIAS) measures the distance between the price and the moving average. There is a saying that "if the price is divided for a long time, it will close, and if it closes for a long time, it will divide." The same applies to the capital market, which means "if it rises too much, it will pull back, and if it falls deeply, it will pull back." rebound". The deviation rate uses the distance between the current price and the moving average to measure whether it is a "long rise" or a "long fall". If the price is too far away from the moving average, the probability of the price correcting to the moving average will greatly increase. It is therefore a measure of short-term overbought or oversold, with the following formula:
How to look at the deviation rate
The deviation rate can be divided into positive deviation rate and negative deviation rate. When the price is above the moving average, it is called positive deviation rate; when the price is below the moving average, it is called negative deviation rate:
Positive deviation: closing price moving average, indicating overbought and possible downward or correction pressure. The larger the number, the higher the probability of a decline.
Negative deviation: closing price moving average, indicating that it is oversold and there will be an opportunity to rise or rebound. The smaller the number, the greater the chance of an increase.
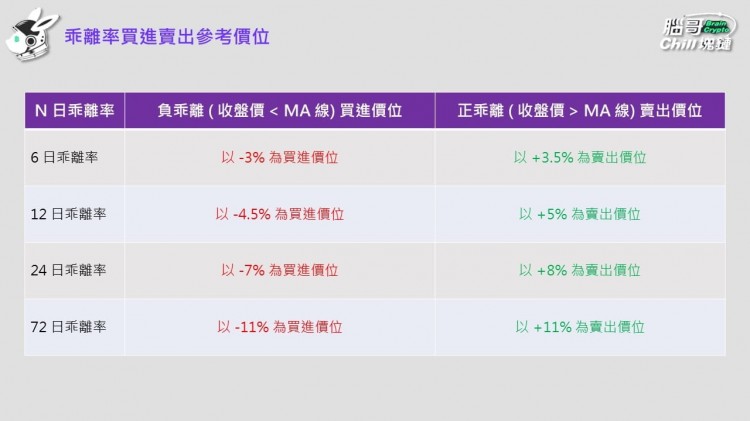
The deviation is called "more". The following provides a benchmark to serve as a reference. The variables can be changed according to the investor's risk tolerance.
Advantages and Disadvantages of Deviation Rate
advantage:
Overbought and oversold warnings: When divergence reaches extreme levels, it may indicate that the market is overbought or oversold, which may signal the possibility of a price reversal.
Relatively intuitive: The calculation of deviation rate is relatively simple and easy to understand. This makes it an indicator that both beginners and experienced traders can use.
Not limited by time frames: divergence rates can be applied on different time frames to adapt to different trading styles.
shortcoming:
Not suitable for volatile markets: When the market is moving sideways or oscillating, the deviation rate does not change much, the signals provided are not accurate enough, and the reference value is easily lost.
Overly sensitive: The deviation rate is very sensitive to price changes and may be disturbed by short-term noise. This causes it to generate signals too frequently in some situations.
Cannot be used independently: Divergence usually needs to be used in conjunction with other technical indicators or analytical tools to provide more reliable trading signals.
The Bollinger Band is a band-shaped track composed of an MA line and a standard deviation. It is somewhat similar to the concept of deviation, advocating "mean return". It is called a channel because it has upper and lower bounds, price It is considered a normal situation within the boundary, but the price performance outside the upper and lower boundaries is overvalued or undervalued, and will return to the channel before long. Therefore, we can buy when the price is lower than the channel and sell when it is higher than the channel. What are the upper and lower bounds respectively? This is related to statistics. In the normal distribution of statistics, the probability of a single sample number appearing within plus or minus two standard deviations of the mean is 95.4%. The Bollinger Band is derived from this, using 20MA as the benchmark, and the channel The upper bound (upper rail) = 20MA + 2 standard deviations, the lower bound of the channel (lower rail) = 20MA - 2 standard deviations, the middle line (middle rail) = 20MA, and the bandwidth is between the upper rail and the lower rail distance. The 20 MA and 2 standard deviation mentioned above are common Bollinger Band parameter settings. Of course, they can also be changed according to investors' preferences.
How to read Bollinger Bands
Bollinger Bands has three long signals and two short signals.
bull signal
When the K line crosses the lower track from bottom to top, it is a buy signal.
When the K line crosses the middle line (20MA) downwards and upwards, the stock price may accelerate upward, which is a signal to increase buying.
When the K-line falls between the middle line and the upper rail, and the trend is still bullish, you can continue to go long.
bear signal
The K line falls between the middle line and the upper rail, and breaks through the middle rail from top to bottom, which is a sell signal.
When the K line falls between the middle line and the lower rail and is still in a short downward trend, you can continue to short.
The situation just mentioned is when the Bollinger Channel pattern remains unchanged, but the shape of the channel will appear in different patterns depending on the market. At this time, it is divided into the same direction type and the opposite direction type:
Same direction pattern: The so-called same direction means that the upper rail, lower rail, and middle line move in the same direction with the same amplitude.
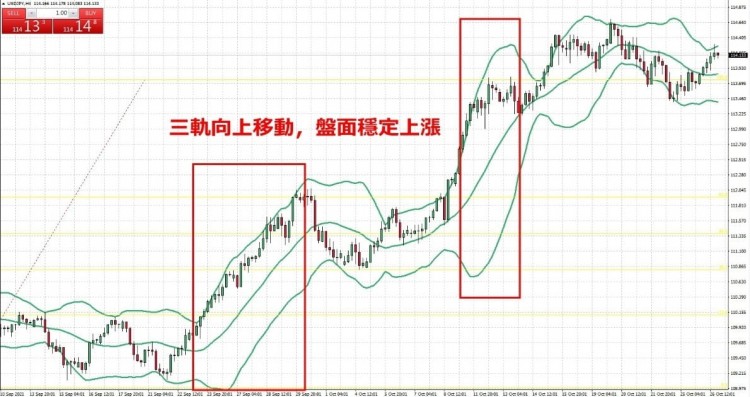
Three-track upward: The Bollinger Bands move up simultaneously and maintain within a certain period of time, which generally indicates that the bulls are strong, the market will rise steadily, and the retracement will be shallow during the period. At this time, even if the price has a tendency to break through the upper track, there is no need to rush to sell.
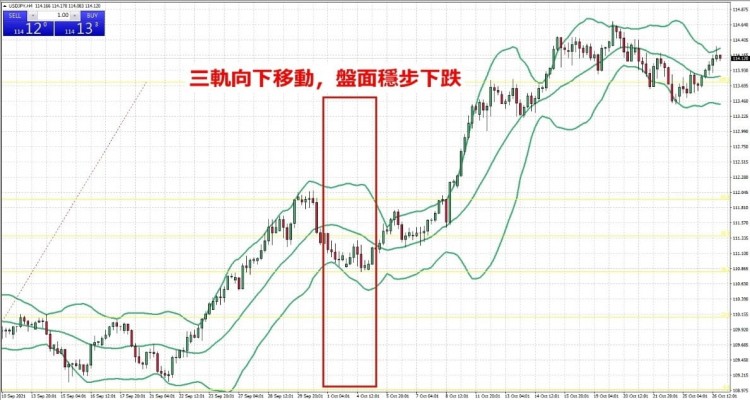
Three tracks downward: The Bollinger Bands move downward at the same time and are maintained for a certain period of time, which indicates that the short force is relatively stable, the market will gradually decline, and the rebound will be weak.
anisotropy
Bollinger Band Expansion: The opening of the channel is usually a small burst of short-term market conditions, followed by a small period of increase or decrease, and the trend will not be too fast. If the opening of the channel is accompanied by the K-line crossing upward or approaching the upper rail, the stock price is relatively strong and there is no need to rush to sell. If the opening of the channel is accompanied by the K-line crossing downward or close to the lower track, the stock price is relatively weak, and there may be a small decline next.
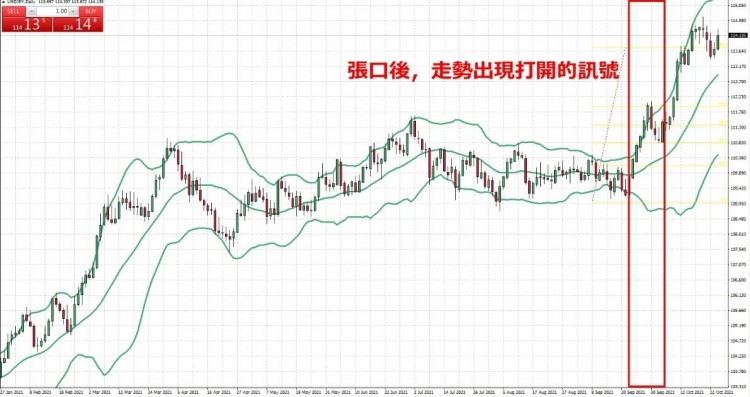
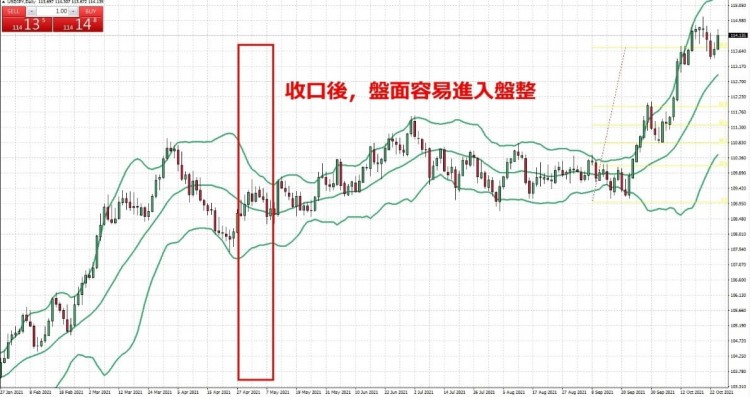
Narrowing Bollinger Bands: This indicates that market volatility is decreasing, and also indicates the potential for large price fluctuations in the future. At this time, the market is prone to consolidation, so when the Bollinger Band maintains its closing pattern, you have to continue to wait for a new direction to appear, wait for the mouth to open, or wait for the subsequent three rails to move upward or the third rail to move downward. This is to give a new short-term direction. choose.
Bollinger Bands Advantages and Disadvantages
advantage:
Powerful functionality: able to judge volatility and identify potential support and resistance.
Dynamic adjustment: It is forward-looking and will adjust its support and resistance as the price changes.
Identify market status: Through the contraction and expansion of bandwidth, it can help identify market activity.
Divergence identification: If the price reaches a new high or a new low, but the Bollinger Bandwidth changes out of sync or in the opposite direction, this can give investors a warning or entry opportunity.
shortcoming:
Lag: It is an indicator based on moving average, so Bollinger Bands will have a certain lag. This means that in fast-moving markets, signals will lag slightly.
Misleading Signals: In highly volatile markets, prices frequently break out of upper and lower bands, resulting in misleading buy and sell signals.
Few aspects considered: Bollinger Bands focus on price and volatility and ignore other factors that affect the market, such as trading volume, market sentiment or macroeconomic data.
Parameter Selection: Default Bollinger Bands parameters (such as 20-day moving average and 2x standard deviation) may not work for all assets or time frames. If the parameters are inappropriate, the performance of Bollinger Bands may be affected.
The four articles so far have introduced several common technical analysis indicators and the long and short meanings behind them, including K line, MA line, MACD, KD, RSI, etc. I believe you have read all the previous articles. Already possess basic technical analysis knowledge. Starting from the next issue, we will enter the type chapter. Remember to follow Nao Ge’s Binance Square personal account to get the most immediate article notifications!